One Integrated Platform for Climate Action
Your complete GHG inventory — Scope 1, 2 and all 15 Scope 3 categories. Collect data from anyone, approve it at row level, and generate audit-ready reports.
Free Tier · Four ready-made submission forms from the moment you sign up
Free Tier
Sign up and start collecting — four ready-made submission forms, a link to share, and a dashboard that tracks your inventory month by month.
Sign up — your forms are ready
Four submission forms are created for you the moment you sign up. Nothing to build.
Copy the link and send it out
Colleagues, sites, departments — respondents just follow the link.
Review submissions
Look over responses as they arrive — every entry lands in your GHG inventory.
Track it on your dashboard
Your full inventory in one view, trackable month by month as submissions come in.
Forms created for you
Free Tier
FreeYour ready-made forms
Created for you at sign-up
K. Tan · Site A
KL → Singapore, flight
A. Rahman · HQ
Monthly electricity, 4,120 kWh
Responses appear in your dashboard instantly
Carbon accounting that holds up
Built to the GHG Protocol, run like a workflow, and defensible line by line.
Complete GHG Inventory
Scope 1, Scope 2 and all 15 Scope 3 categories — from Stationary Combustion to Investments — computed in tCO2e with per-gas breakdowns (CO₂, CH₄, N₂O and more).
Data Collection That Runs Itself
Send request forms to suppliers, sites and staff. Schedules, reminders and deadlines keep data flowing — recipients need no account.
Audit-Ready by Design
Structured GHG Emissions Reports with methodology, IPCC GWP tables and a full emission-factor reference — plus audit trails and attachments behind every number.
From setup to report in four steps
Set up in minutes
Add your country and facilities, and start from a library of predefined measures — Malaysian grid factors included.
Collect from anywhere
Quick submission forms, full request campaigns, or bulk Excel/CSV import with column mapping.
Review & approve
Row-level approvals with multi-approver support. Request changes and recipients resubmit only what changed.
Report with confidence
Generate a GHG Protocol–structured report, save configurations, and export to PDF.
Your whole footprint at a glance
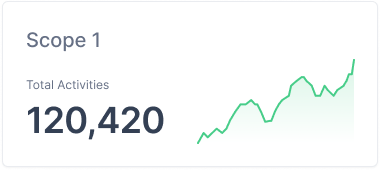
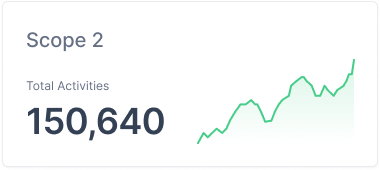
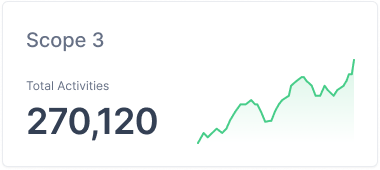
The GHG Inventory Summary puts Scope 1, 2 and 3 side by side — filter by year or any date range.
- Scope cards with tCO2e totals and trends
- Emissions by Category breakdown
- Monthly and yearly emissions trends
- Top 5 Predefined Measures at a glance
Total GHG Emissions
All Scopes164,080.11 tCO2e
Scope 1
Direct20,562.85 tCO2e
Scope 2
Indirect Energy7,544.57 tCO2e
Scope 3
Indirect Other135,972.68 tCO2e
Emissions by Category
Emissions (tCO2e)
Data collection with a real workflow
Build request forms from your own measures, send them on a schedule, and review every row before it enters your inventory.
- Build Form, Recipients, Settings, Tracking and Submissions — one workspace
- Pre-made Travel, Electricity and Water modules; travel routes with real distances, flight haul and cabin class
- Multi-approver reviews with request-changes and partial resubmission
- Open submission links — recipients need no account
Q3 Supplier Data Request
SavedK. Tan · Site A Travel
KL → Singapore · Economy flight
A. Rahman · Supplier Electricity
4,120 kWh · Peninsular Malaysia
J. Lee · HQ Water
312 m³ · Q3 total
From ledger to boardroom
Generate a structured GHG Emissions Report that shows its working — methodology, boundaries, factors and facility detail included.
- GHG Protocol–structured sections, ready for stakeholders
- Facility emissions with per-headcount and per-area intensity
- Full emission-factor reference: factor, unit, source, year, method
- IPCC GWP tables (AR4, AR5, AR6), saved report configurations, PDF export
Configuration
Period
Jan 2025 – Dec 2025
Facilities
All facilities (3)
Generate ReportSaved Reports · FY2025 Full · Q2 Board Pack
Report Preview
Save as PDFGHG Emissions Report
Reporting period: 1 Jan – 31 Dec 2025
Total: 164,080.11 tCO2e
1. Introduction
2. Greenhouse Gas Inventory Boundaries
3. Greenhouse Gas Inventory
4. Emission Sources and Emission Factor Reference
5. Methodology and Sources
Financed emissions, PCAF-aligned
For financial institutions: measure the emissions of your portfolio across nine asset classes, with data quality you can defend.
- Asset classes from listed equity to CRE, mortgages and sovereign bonds
- Attribution factors and Data Quality Scores (1–5) with weighted-average DQS analytics
- Dashboards in tCO2e and tCO2e per RM million, plus Excel export
- AI AI DQS Library: upload a client's PDF sustainability report — AI extracts Scope 1/2/3 totals, assurance status and a data quality score with page-level citations
Total Financed Emission
62,410 tCO2e
Emission Intensity
38.2 tCO2e / RM mil
Weighted Avg DQS
2.7 of 5
Financial Assets
Export to ExcelBusiness Loan · Manufacturing
24,180 tCO2e DQS 2CRE · Office, Kuala Lumpur
18,930 tCO2e DQS 3Mortgage · Residential
9,540 tCO2e DQS 4SustainabilityReport-2025.pdf analysed
Scope 1/2/3 extracted · Assured ✓ · DQS 2 · cited p.47, p.83
Everything around the numbers
The operational layer that makes an inventory trustworthy.
S&G Tracker
Social and governance metrics alongside your emissions — seeded with the Bursa ESG metric set, with frequencies, attachments and charts.
Emission Factor Database
Factors by country, source and year — BEIS/DEFRA, IPCC, IEA and US EPA, plus Malaysian grid factors for Peninsular Malaysia, Sabah and Sarawak.
Facilities & Audit History
Every site tracked, every change logged — full audit trails across facilities and measures.
Roles & Permissions
Granular access with view, manage and admin levels — plus external approvers scoped to a single request.
Bulk Import
Excel and CSV uploads with sheet selection, column mapping and downloadable templates.
Secure by Default
Passwordless OTP sign-in, company-scoped data, and single sign-on via OpenID Connect.
Grounded in recognised frameworks
The methodologies and frameworks referenced across the platform and its generated reports.
Leading the Way in Carbon Reduction
See how organizations are achieving their sustainability goals with Carbon GPT

MST Golf achieved comprehensive carbon tracking across their retail network and supply chain with Carbon GPT, leading to significant emissions reductions and cost savings.

Ready to try?
Book a demo today.
Book a demo